When we run any java application, we are running JVM. That JVM uses resources like memory, processor etc. Same happens when we run any spring application too; it runs and uses our hardware resources. Monitoring and measuring these parameters is crucial when we are in production or when we like to test the performance of our application. With spring, it is easy. We should just include spring actuator and it will give us access to almost all measurements that we need like:
"jvm.memory.max",
"jvm.threads.states",
"jvm.gc.memory.promoted",
"jvm.memory.used",
"jvm.gc.max.data.size",
"jvm.gc.pause",
"jvm.memory.committed",
"system.cpu.count",
"logback.events",
…
To set up spring actuator add the following dependency in our project:
<dependency>
    <groupId>org.springframework.boot</groupId>
    <artifactId>spring-boot-starter-actuator</artifactId>
</dependency>
and on the following endpoint:
<host/context-path>/actuatorwe will have basic links to additional features of the application and monitoring:
{
    "_links": {
        "self": {
            "href": "http://localhost:8080/actuator",
            "templated": false
        },
        "health": {
            "href": "http://localhost:8080/actuator/health",
            "templated": false
        },
        "health-path": {
            "href": "http://localhost:8080/actuator/health/{*path}",
            "templated": true
        },
        "info": {
            "href": "http://localhost:8080/actuator/info",
            "templated": false
        }
    }
}
If these basic information are not enough we can extend them with adding the following parameter in the application configuration file:
management.endpoints.web.exposure.include=*By following any of these links, we will access the details. For our use it will be http://localhost:8080/actuator/metrics from which we are going to access to the metrics of our application.
Now we have almost everything what we need to monitor our application how it performs. Requests, JVM memory, cache, threads etc…
Micrometer
However, if we have some more logic in our code and we need more precise metrics for our application and want to get metrics for our code we will need some other way to get them. Spring Boot 2 Actuator enrich all this already exiting metrics with the micrometer data provider.
“Micrometer is a dimensional-first metrics collection facade whose aim is to allow you to time, count, and gauge your code with a vendor-neutral API.”
Moreover, a micrometer is a vendor-neutral data provider and exposes application metrics to other external monitoring systems like Prometheus, AWS Cloudwatch etc…
Micrometer gives a set of Meter primitives and plus including Timer, Counter, Gauge, DistributionSummary, LongTaskTimer, FunctionCounter, FunctionTimer, and TimeGauge. Here we should be aware that every different meter type has a different number of time-series metrics. The gauge has a single metric, but the timer has a count of timed events and a total time of all events timed.
If we write something like this in our code:
List<Integer> gaugeList = registry.gauge("dummy.gauge.list", Collections.emptyList(), someList, List::size);
        List<Integer> gaugeCollectionsSizeList = registry.gaugeCollectionSize("dummy.size.list", Tags.empty(), someList);
        Map<Integer, Integer> gaugeMapSize = registry.gaugeMapSize("dummy.gauge.map", Tags.empty(), someMap);

registry.timer("dummy.timer", Tags.empty()).record(() -> {
            slowDummyMethod();
        });
We will have three parameters for the Timer (dummy_timer_seconds_count, dummy_timer_seconds_max. dummy_timer_seconds_sum) and dummy_gauge_list, dummy_gauge_map, dummy_gauge_list.
All this data can be used from many monitoring systems like Netflix Atlas, CloudWatch, Datadog, Ganglia etc… Here in our case, we will use Prometheus.
Prometheus
Including Prometheus in our project is easy with adding maven dependency:
<dependency>
    <groupId>io.micrometer</groupId>
    <artifactId>micrometer-registry-prometheus</artifactId>
</dependency>
This will create the new endpoint in the actuator http://localhost:8080/baeldung/actuator/prometheus. If we access this URL we will get the metrics from the micrometer.
To see this data in some graphic UI we will have to start Prometheus server. We can do that directly by downloading the Prometheus server and run it.
The configuration is in the prometheus.yml file.
Basic parameters that we should set up here are:
global:
  scrape_interval:     10s # Scrape interval to every 10 seconds. Default value is every 1 minute.
and
scrape_configs:
  - job_name: 'spring_micrometer'

    metrics_path: '/micromexample/actuator/prometheus' # Path to the prometheus end point in our application. “micromexample” is the context and “actuator/prometheus” is default path for prometheus in our application
    static_configs:
    - targets: ['localhost:8080'] # host where our application is deployed
Or another way to have Prometheus server we can run docker image which will contain Prometheus in it. We can do that with the following command:
docker run -d -p 9090:9090 -v <yours-prometheus-config-file.yml>:/etc/prometheus/prometheus.yml prom/prometheus
“9090” – the port where our Prometheus will listen, this value is the default port
<yours-prometheus-config-file.yml> – our configuration file for Prometheus
“prom/prometheus” – docker image with Prometheus
After we run spring boot application with Prometheus included and we run Prometheus server we should be able to see the metrics in some basic view from Prometheus
this is what we should get from our service:
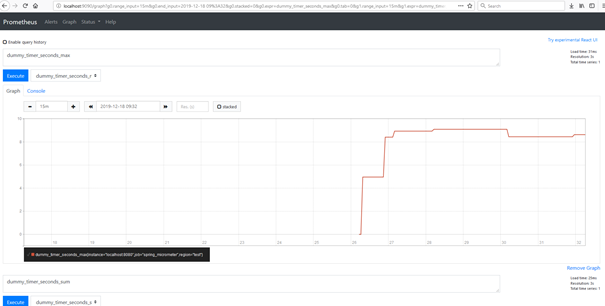
For this graph, we wrote the following code (to have something to be sure that everything works)
registry.timer("dummy.timer ", Tags.empty()).record(() -> {
    slowDummyMethod();
});
Grafana
If we want, reach graphical UI, easy to browse through the metrics data, dashboard editing, cloud monitoring compatibility then it will be a good idea to use Grafana.
Setting up Grafana is similar to Prometheus, we will need a Grafana server.
Again, we can download and install it locally. Like this, we will have service in our OS:
Or run docker image with Grafana in it:
docker run -d -p 3000:3000 grafana/grafana“3000” – port for grafana
“grafana/grafana” – docker image with grafana
Default user and password are admin/admin. On the first login, you will be asked to add a new password.
After we log in we should add source, wherefrom Grafana will read the metrics. Go to the following left menu: Configuration -> Data Sources, chose the “Data Sources” tab and add new data source “Add data source”.
Since we decided to go with Prometheus we will select Prometheus source. In the new page (Configuration), because we did not set any authentication or anything else in Prometheus – everything is default, we need just to set HTTP -> URL field. For our case, it will be “http://localhost:9090”. If everything is ok by clicking “Save and test” we should get a green bar that Grafana is connected to Prometheus and we can access the metrics from it.
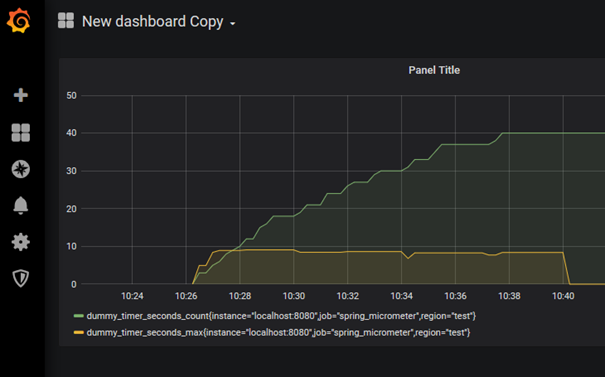
Let’s see our first metrics from the timer that we added in our application. For this one we will create our own new dashboard:
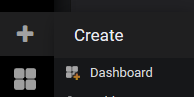
Chose “Add Query” and in the new window add following key in the “Metrics”: “dummy_timer_seconds_count”. This will add one metric in our graph.
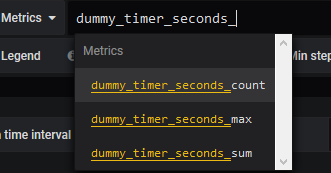
In the same graph, we can add the second one from the timer “dummy_timer_seconds_max”. With this, we will have both metrics in the same graph.
There are other parameters that you can set, but for basic setup default values are fine.
With this, we have set up everything we need for monitoring our application. Next is to add more graphs for metrics that we want to monitor.