Today, we are gonna take a look at JMeter. You can embed it in your application as a library and make an external integration testing solution. You don’t have to use it for load testing, it could simply send onej request, check the return status code, check the return value and move on. There is an argument that JMeter may be overkill for that, but it provides an easy way to verify the return, allows you to set it up using JMeter desktop app and then you can move into testing latency under load.
First, we need to create a test file that will be put later in our spring boot application. The steps for creating the .jmx file are as follows:
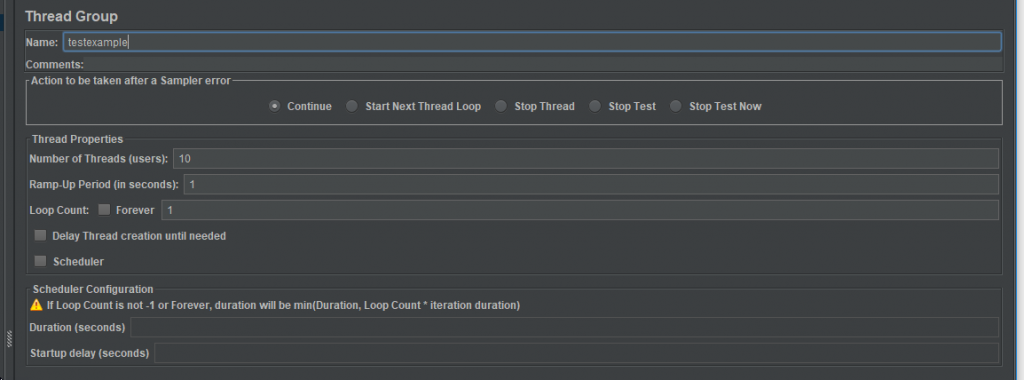
1 – Open the JMeter window by clicking on /home/apache-jmeter-5.1.1/bin/jmeter.bat. The next step you want to do with every JMeter Test Plan is to add a thread group element. Set the “Loop Count” parameter equal to 1, as shown below:
2 – The next step is to create a while controller. The purpose the while controller is to repeat a given set of actions until the condition is broken. While is a basic programming concept to run actions where the number of iterations to run are unknown or varying.
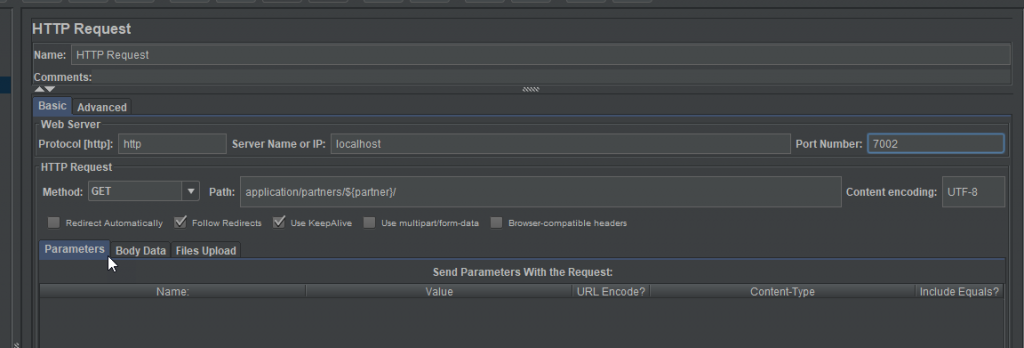
3 – Create an HTTP request as shown in the figure below:
4 – Afterwards, we are gonna create a CSV Data Set Config. This step refers to the CSV file for which the partner users will be collected and replaced as in the httprequest.
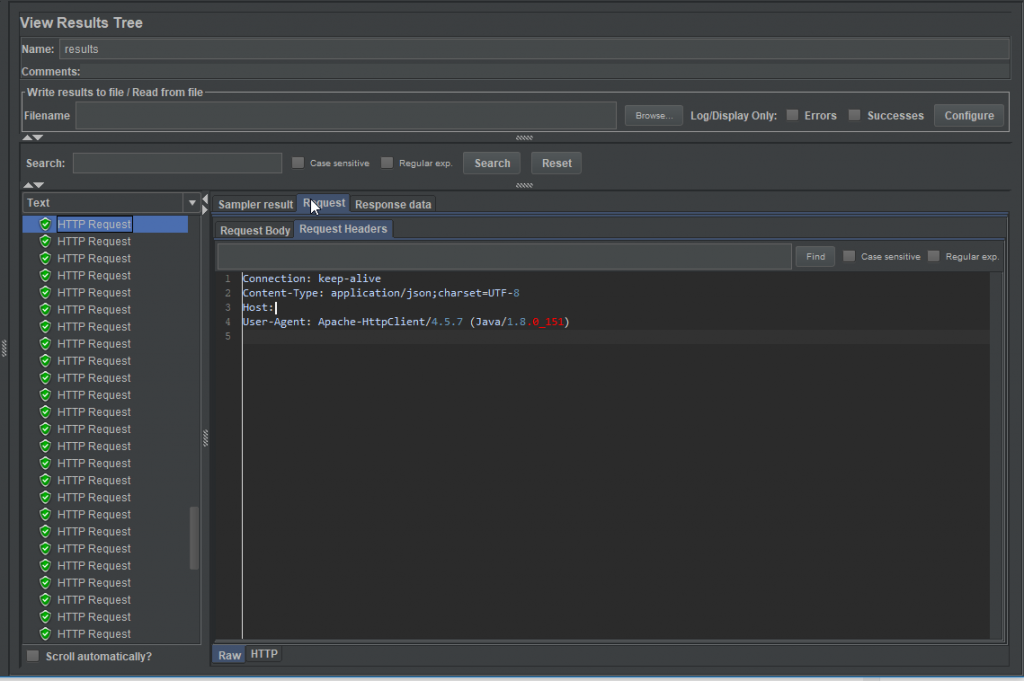
5- After running our test, we want to see the results e.g. which calls have been done, and which ones have failed. This is done through Listeners, a recording mechanism that shows results, including logging and debugging.
The View Results Tree is the most common Listener.
Right-click – Add->Listener->View Results Tree
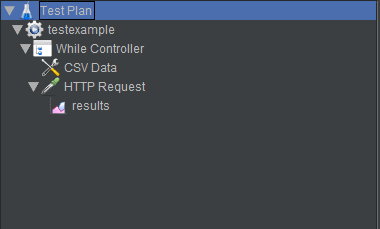
6 – At the end, it should be something like the figure below:
Now click ‘Save’. Your test will be saved as a .jmx file. To run the test, click the green arrow on top. After the test completes running, you can view the results on the Listener as in the figure below. In this example, you can see the tests were successful because they’re green. On the right, you can see more detailed results, like load time, connect time, errors, the request data, the response data, etc. You can also save the results if you want to.
JMeter can also be used for Maven testing through a plugin and work quite nicely with variables and prerequisites etc. Integrating Performance Testing in your projects has many benefits:
- It provides a constant check of the performances of the application
- Secures continuous delivery in production
- Allows early detection of performance problems or performance regressions
- Automates the process means less manual work, allowing your team to focus on more valuable tasks like performance analysis and optimisation
First of all, you need to add your plugin to the project. So go to Maven project directory (jmeter-testproject in this case) and edit the pom.xml file. Here you must add the plugin. You can find the basic configuration here. You just need to copy the configuration text and paste it in your pom.xml file.
Finally, you have a pom.xml file that looks like this:
<?xml version="1.0" encoding="UTF-8"?>
<plugin>
   <groupId>com.lazerycode.jmeter</groupId>
   <artifactId>jmeter-maven-plugin</artifactId>
   <version>2.9.0</version>
   <executions>
      <execution>
         <id>jmeter-tests</id>
         <phase>test</phase>
         <goals>
            <goal>jmeter</goal>
         </goals>
      </execution>
      <execution>
         <id>jmeter-check-results</id>
         <phase>test</phase>
         <goals>
            <goal>results</goal>
         </goals>
      </execution>
   </executions>
   <configuration>
      <testFilesDirectory>src/test/resources/jmeter</testFilesDirectory>
      <ignoreResultFailures>false</ignoreResultFailures>
   </configuration>
</plugin>
In the code above we will be running 2 goals:
- jmeter in phase Test: This goal will run the load test and generate the HTML report
- results in phase Test: This goal runs some verification on error rate and fails the build